Overview
In light of the global effort to better understand the new SARS-CoV-2 virus, we and other researchers from the HCA Lung Biological Network and beyond have begun an initiative to investigate datasets from relevant tissues profiled as part of other ongoing studies. These studies represent, for example, large efforts to characterize HIV, Mtb, and influenza infection and allergy in primary human and non-human primate samples. This page serves as a guide to viewing our data interactively on and downloading datasets from our single-cell portal, the Alexandria Project. Alternatively, bulk downloading of our data is available here. For more on research initiatives in COVID-19 being undertaken by the HCA, and the HCA Lung Biological Network in particular, please visit the HCA website here.
We investigated two genes whose protein products are central to the cellular entry of SARS-CoV-2: ACE2 and TMPRSS2. Consistent with previous studies, we found that the gene encoding ACE2, the SARS-CoV-2 entry receptor, is expressed on a subset of lung epithelial cells, type 2 pneumocytes, and a subset of ileal epithelial cells, absorptive enterocytes, across several datasets. The protease TMPRSS2 primes the spike protein of SARS-CoV-2 and is also important for viral entry. Because of this, we identified cells which co-express ACE2 and TMPRSS2 in our datasets, and investigated additional genes enriched within ACE2 and TMPRSS2 co-expressing cells. As we believe this data may prove useful to other researchers investigating similar questions, we have made our datasets public through the interactive Alexandria Project. Here, you can view our annotations of these datasets and investigate which other genes are highly expressed in these cell subsets of interest.
NB None of the datasets presented here were designed to answer specific questions about COVID-19. Additional studies will be required across larger, appropriately structured cohorts. Further, we provide a note of caution when interpreting scRNA-seq data for low abundance transcripts like ACE2 and TMPRSS2 as detection inefficiencies and/or sequencing depth may result in an underestimation of the actual frequencies of ACE2+ or ACE2+/TMPRSS2+ cells in tissues. Moreover, the protein levels of each may differ from their mRNA abundances. We present each data set separately, as each study differed by method of tissue processing and collection protocols, each of which can influence the frequency of recovered cell subsets.
Analysis
Our pre-print “SARS-CoV-2 receptor ACE2 is an interferon-stimulated gene in human airway epithelial cells and is enriched in specific cell subsets across tissues” can be found here, and the abstract is reproduced below.
There is pressing urgency to better understand the pathogenesis of the severe acute respiratory syndrome (SARS) coronavirus (CoV) clade SARS-CoV-2. SARS-CoV-2, like SARS-CoV, utilizes ACE2 to bind host cells. While initial SARS-CoV-2 cell entry and infection depend on ACE2 in concert with the protease TMPRSS2 for spike (S) protein activation, the specific cell subsets targeted by SARS-CoV-2 in host tissues, and the factors that regulate ACE2 expression, remain unknown. Here, we leverage human and non-human primate (NHP) single-cell RNA-sequencing (scRNA-seq) datasets to uncover the cell subsets that may serve as cellular targets of SARS-CoV-2. We identify ACE2/TMPRSS2 co-expressing cells within type II pneumocytes, absorptive enterocytes, and nasal goblet secretory cells. Strikingly, we discover that ACE2 is an interferon-stimulated gene (ISG) in human barrier tissue epithelial cells. Thus, SARS-CoV-2 may exploit IFN-driven upregulation of ACE2, a key tissue-protective mediator during lung injury, to enhance infection.
Datasets
Atlas of ACE2 expression in healthy non-human primate lung and ileum
In this study, we collected cells from various tissues in healthy and SHIV-infected non-human primates using Seq-Well v1. Here we highlight the lung and ileum and show that ACE2 and TMPRSS2 are co-expressed most frequently in type II pneumocytes in the lung and absorptive enterocytes in the ileum.
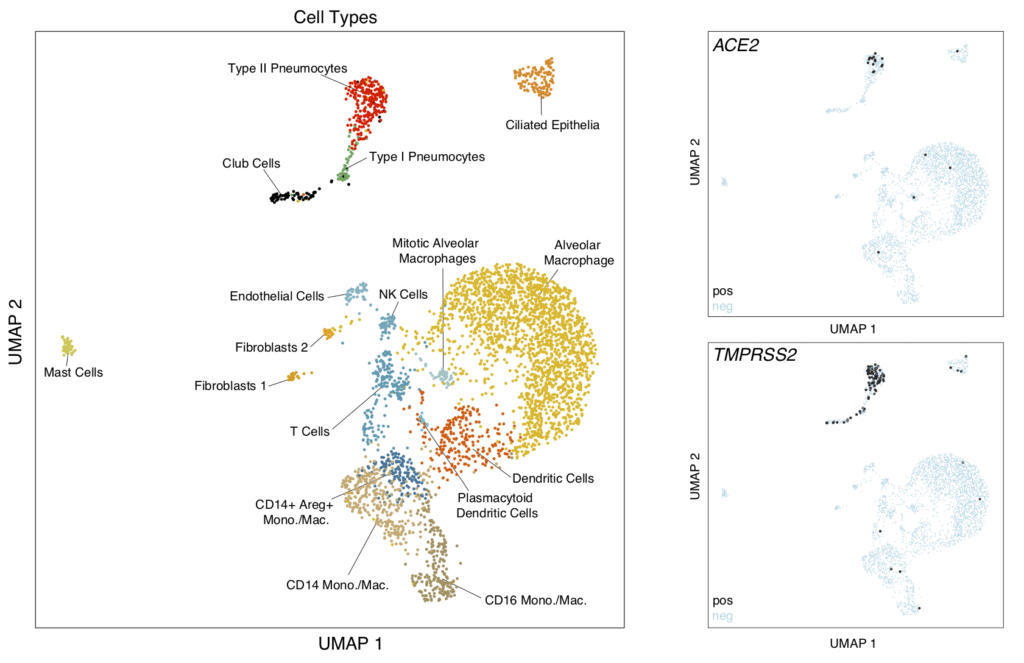
To visualize these cells in the Alexandria Project, visit this study: Atlas of healthy non-human primate lung and ileum ACE2+ cells
This project contains two UMAP visualizations (one for lung cells and one for ileum cells): toggle between them by clicking on the ‘Explore’ tab, select ‘View Options’ in the top right hand corner, and switch between lung and ileum under the ‘Load Cluster’ dropdown.
For each of the lung and ileum cell UMAPs, we provide subsets of these visualizations which contain only the cell types enriched for double positive cells. By selecting the ‘Load cluster’ options called ‘Lung Epithelial Cells’ or ‘Ileum Absorptive Enterocytes’, you will be able to view gene expression differences between double positive cells and other cells within those cell types. In the lung epithelial cells visualization, the following additional annotations are available under the ‘Select Annotation’ dropdown:
- ACE2+ – cells expressing ACE2
- TMPRSS2+ – cells expressing TMPRSS2
- ACE2_TMPRSS2_double_positive – cells expressing both genes
- celltype_double_positive – the cell type column and double positive column combined so genes that are differentially expressed between only one cell type may be viewed
- celltype_ACE2+ – same as above for ACE2 expression
After selecting one of these annotations, you can then search for a gene of interest in the ‘Search Genes’ box in the left corner to view the expression of that gene as a violin plot split by the annotation you select. For example, to reproduce Figure 1D in the manuscript, you would select annotation “ACE2_TMPRSS2_double_positive” and search for gene ‘IFNGR2’ in the ‘Search Genes’ box.
The same options are available for the ileal absorptive enterocytes visualization except that the cell type is combined with the double positive/ACE2 column since this subset only includes one cell type.
Full expression matrices (and therefore gene expression values visible when using the ‘Search Genes’ box) are available only for epithelial cell types as this data is derived from a pre-publication study.
Atlas of ACE2 and TMPRSS2 in human ileum
In this study, samples from human ileum were collected, processed, and run on 10x 3′ v2 show ACE2 and TMPRSS2 co-expression in absorptive enterocytes.
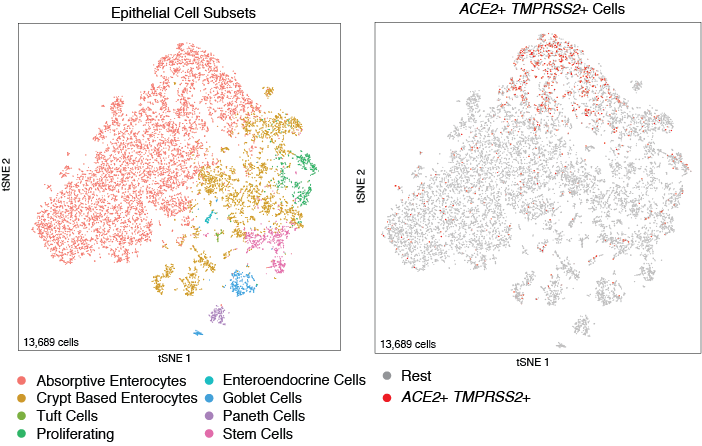
To visualize these cells in the Alexandria Portal, visit this study: ACE2 and TMPRSS2 most enriched within GSTA1+MGST3+ absorptive enterocytes in context of non-inflamed terminal ileum
Two tSNE visualizations are available for this study, one of all cells in the ileum samples “non-inflammed-tsne” and one of just the epithelial cells in the samples “non-inflammed-epth-tsne”. To toggle between these, select the “Explore” tab under the study title, then select ‘View options’ from the upper right corner of the plot and choose the visualization of interest in the ‘Load cluster’ dropdown.
Full expression matrices (and therefore gene expression values visible when using the ‘search genes’ box) are available only for the epithelial cell types as this data is derived from a pre-publication study.
Atlas of ACE2 and TMPRSS2 expression in human HIV- and TB-infected lung
In this study, samples from lung surgeries were run with Seq-Well S^3 and contain a variety of immune and epithelial cell types. We found the majority of ACE2 and TPRSS2 double positive cells in type II pneumocyte cells.
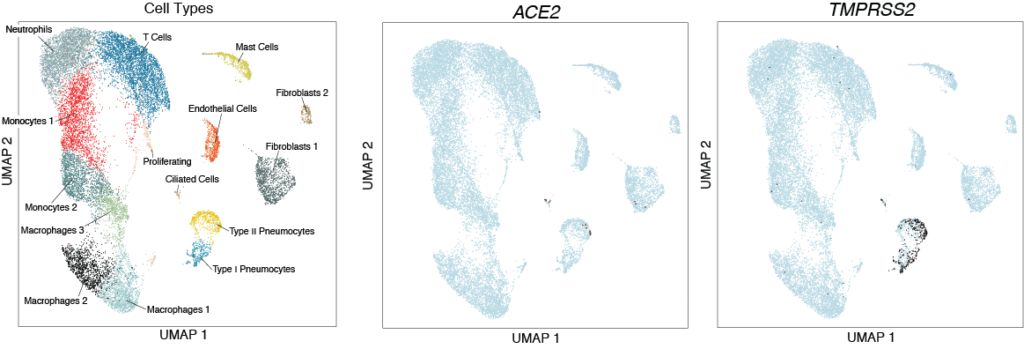
To view these cells in the Alexandria Project, visit this study: Human lung HIV-TB co-infection ACE2+ cells
To visualize the double positive cells in these samples, click the ‘Explore’ tab, then select ‘View Options’ in the top right corner of the plot and choose ‘ACE2_TMPRSS2_double_positive’ under the ‘Select Annotation’ dropdown menu.
Full expression matrices (and therefore gene expression values visible when using the ‘search genes’ box) are available only for epithelial cell types as this data is derived from a pre-publication study.
A subset of ACE2+ secretory cells in human nasal mucosa
In this study, we find a subset of secretory cells which co-express ACE2 and TMPRSS2.

To visualize these cells on the Alexandria Project, visit this study: Allergic inflammatory memory in human respiratory epithelial progenitor cells
To view the tSNE of epithelial cells, select the ‘Explore’ tab, select ‘View Options’ in the right hand corner of the plot and choose ‘Epithelial cells’ in the ‘Load Cluster’ dropdown. To view the cell type annotations in the first panel of the above plot choose ‘subset’ in the ‘Select Annotation’ dropdown menu. To view the ACE2/TMPRSS2 double positive cells, select ‘ACE2_TMPRSS2’ from the ‘Select annotation dropdown menu, and to view the cluster subsets from the third panel of this plot, select ‘res_0_8’ from the ‘Select Annotation Dropdown Menu’.
ACE2 and TPRSS2 co-expressing cells found in non-human primate granulomas and adjacent uninvolved lung tissue
In this study, we collected lung tissue from non-human primates infected with mTB. These tissues come from both mTB granulomas and adjacent uninvolved lung in the same monkey.
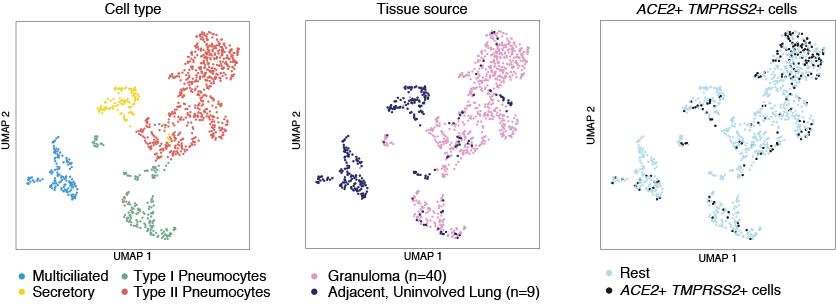
These cells, profiled using Seq-Well S^3, can be investigated interactively in the Alexandria Project: Epithelial cells in NHP TB granuloma and uninvolved lung
To view the data colored by granuloma and uninvolved lung choose the “Granuloma” annotation accessible by clicking “View Options” in the top right-hand corner and selecting from the “Select Annotation” dropdown menu.
Full expression matrices (and therefore gene expression values visible when using the ‘Search Genes’ box) are available only for relevant cell types as this data is derived from a pre-publication study.
Comparison of ACE2 and TMPRSS2 expression in human duodenal and ileal tissue and organoid-derived epithelial cells
In this study, samples from adult human duodenum and ileum were collected and split for primary tissue single-cell RNA-seq and organoid culture under several conditions and profiled with Seq-Well S^3. Organoids were cultured and passaged every 6-8 days in Matrigel domes with established media conditions meant to recapitulate the broad diversity of in vivo epithelial cell types (Fujii, M., et al., Cell Stem Cell. 2018). Organoid culture media contained recombinant Noggin, Rspondin-3, FGF2, IGF1, afamin-Wnt3A, in addition to Gastrin and TGF-b inhibitor A83-01 with and without recombinant EGF (E/NR3+F2I1Gi+Af-W3+A83). Cells co-expressing ACE2 and TMPRSS2 were identified principally within enterocyte clusters of both tissues and organoids.
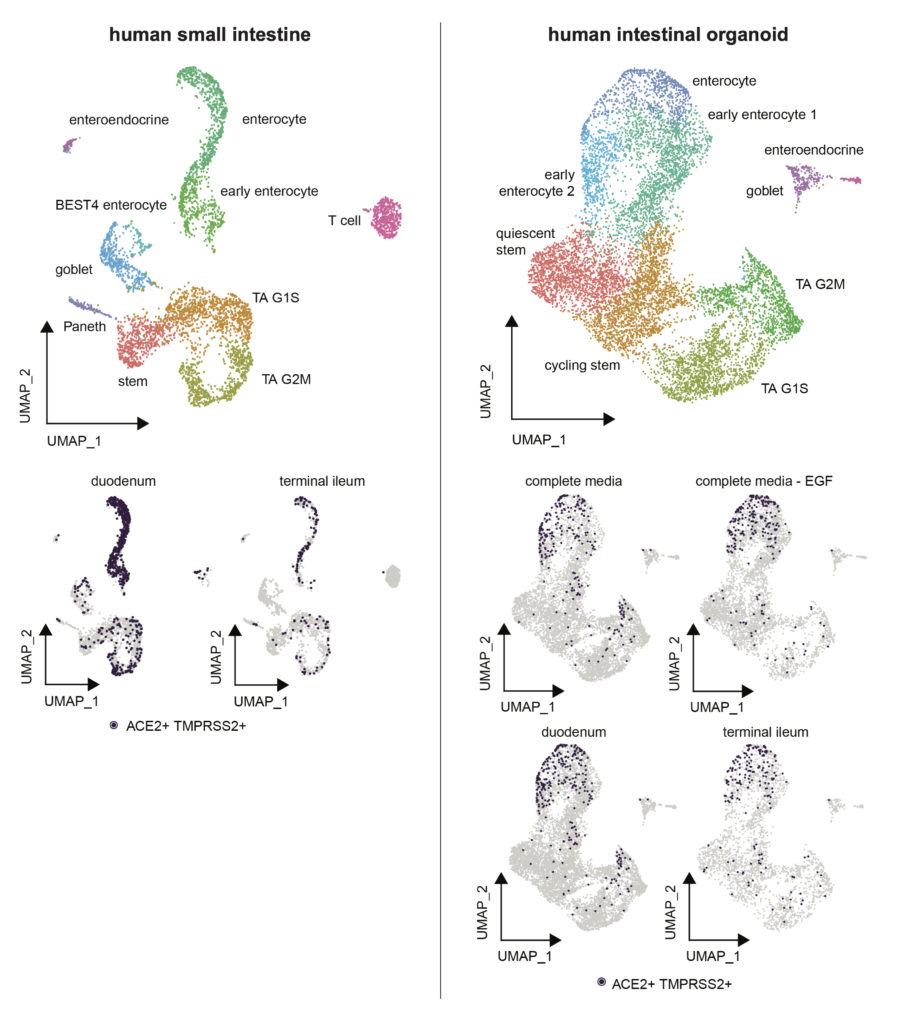
Visualize these samples interactively and read more about this study on the Alexandria Project: Comparison of ACE2 and TMPRSS2 expression in human duodenal and ileal tissue and organoid-derived epithelial cells
This project contains two UMAP visualizations (one for organoid cells and one for primary tissue cells): toggle between them by clicking on the ‘Explore’ tab, select ‘View Options’ in the top right hand corner, and switch between tissue and organoid under the ‘Load Cluster’ dropdown.
To visualize cells which co-express ACE2 and TMPRSS2, select the ‘ACE2_TMPRSS2’ option under the ‘Select Annotation’ dropdown. You can then search for a gene of interest in the ‘Search Genes’ box in the left corner to view the expression of that gene as a violin plot split by the annotation you select.
Full expression matrices (and therefore gene expression values visible when using the ‘Search Genes’ box) are available only for enterocyte cell types as this data is derived from a pre-publication study. Expression of ACE2 and TMPRSS2 are available for all cells.
Interferon regulation of ACE2 in human and murine basal cells
Analysis of these datasets and others lead to the hypothesis that expression of the ACE2 receptor may be upregulated by interferon. To further interrogate this hypothesis, we cultured basal cells from two primary human donors, one human basal cell line, and one mouse trachea and stimulated them with IL4, IL17a, IFNgamma, IFNαlpha, IFNbeta for 12 hours overnight. We performed bulk RNA sequencing and differential expression to show a dose dependent upregulation of canonical ISGs (interferon signaling genes). Specifically, we see that ACE2 is most significantly unregulated following IFN alpha stimulation in primary human basal cells, diminished in the BEAS-2B cell line and not seen in mouse cells.
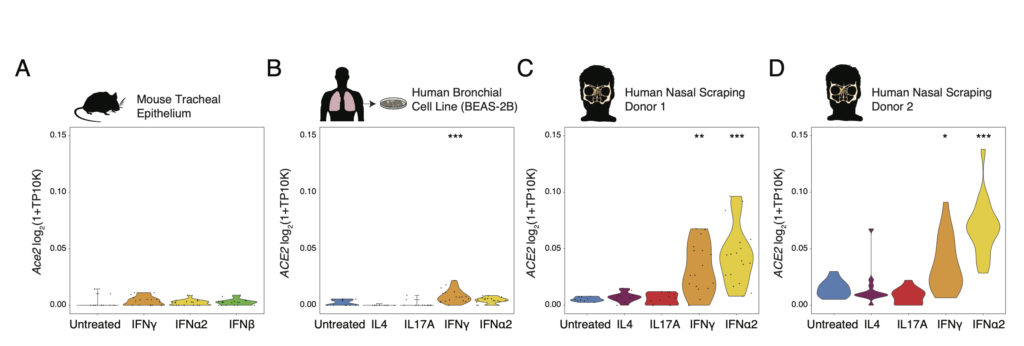
To visualize these samples, the gene expression data may be viewed interactively in the Alexandria Project: Interferon regulation of ACE2 in human and murine basal cells
Under the ‘Explore’ tab, use the ‘Search genes’ field in the top left corner to visualize log-normalized gene expression. To visualize expression in each sample, select ‘View Options’ in the top left corner of the plot and choose the sample of interest under ‘Load cluster’. The ‘Stim_Dose’ annotation refers to the dose of each stimulation condition applied to that sample.
Data for all samples in this study can be dowloaded under the ‘Download’ tab.
Murine nasal mucosa after intranasal interferon exposure
We test the impact of IFNalpha stimulation in vivo by treating two mice intranasally with 200 ng of IFNalpha and two with saline. After 12 hours, the nasal mucosa of the respiratory and olfactory epithelia and underlying lamina propria were isolated and prepared for sequencing with Seq-Well S^3.
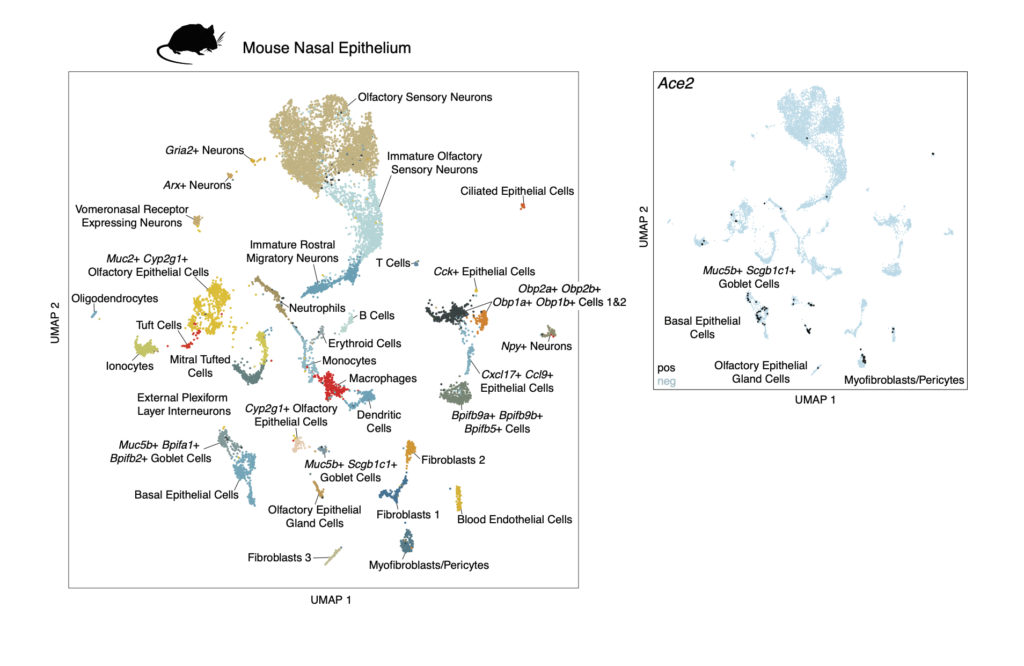
These cells may be viewed interactively in the Alexandria Project: Murine nasal mucosa after intranasal interferon exposure
Data for all samples in this study can be dowloaded under the ‘Download’ tab.
Alexandria Project Details
Single Cell Portal Documentation
We thank the Broad Institute Single Cell Portal team for creating the platform that allows Alexandria to exist and for their working tirelessly to help us share our datasets for others to access.


